A denote the event ' student is female ' and let B denote the event ' student is French ' . In a class of 100 students suppose 60 are French, and suppose that 10 of the French students are females. Find the probability that if I pick a French student, it will be a girl, that is, find P(A|B).
While working with Netflix the movie rating websites you have developed a recommender system that has produced ratings predictions for your data set that are consistently exactly 1 higher for the user-item pairs in your dataset than the ratings given in the dataset. There are n items in the dataset. What will be the calculated RMSE of your recommender system on the dataset?
A data scientist wants to predict the probability of death from heart disease based on three risk factors: age, gender, and blood cholesterol level. What is the most appropriate method for this project?
If E1 and E2 are two events, how do you represent the conditional probability given that E2 occurs given that E 1 has occurred?
You are working in an ecommerce organization, where you are designing and evaluating a recommender system, you need to select which of the following metric wilt always have the largest value?
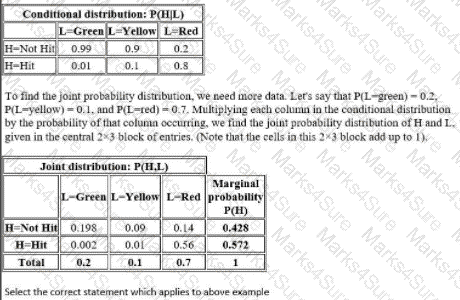
Suppose that the probability that a pedestrian will be tul by a car while crossing the toad at a pedestrian crossing without paying attention to the traffic light is lo be computed. Let H be a discrete random variable taking one value from (Hit. Not Hit). Let L be a discrete random variable taking one value from (Red. Yellow. Green).
Realistically, H will be dependent on L That is, P(H = Hit) and P(H = Not Hit) will take different values depending on whether L is red, yellow or green. A person is. for example, far more likely to be hit by a car when trying to cross while Hie lights for cross traffic are green than if they are red In other words, for any given possible pair of values for Hand L. one must consider the joint probability distribution of H and L to find the probability* of that pair of events occurring together if Hie pedestrian ignores the state of the light
Here is a table showing the conditional probabilities of being bit. defending on ibe stale of the lights (Note that the columns in this table must add up to 1 because the probability of being hit oi not hit is 1 regardless of the stale of the light.)
RMSE is a good measure of accuracy, but only to compare forecasting errors of different models for a______, as it is scale-dependent.
Assume some output variable " y " is a linear combination of some independent input variables " A " plus some independent noise " e " . The way the independent variables are combined is defined by a parameter vector B y=AB+e where X is an m x n matrix. B is a vector of n unknowns, and b is a vector of m values. Assuming that m is not equal to n and the columns of X are linearly independent, which expression correctly solves for B?

What is the best way to evaluate the quality of the model found by an unsupervised algorithm like k-means clustering, given metrics for the cost of the clustering (how well it fits the data) and its stability (how similar the clusters are across multiple runs over the same data)?
Suppose a man told you he had a nice conversation with someone on the train. Not knowing anything about this conversation, the probability that he was speaking to a woman is 50% (assuming the train had an equal number of men and women and the speaker was as likely to strike up a conversation with a man as with a woman). Now suppose he also told you that his conversational partner had long hair. It is now more
likely he was speaking to a woman, since women are more likely to have long hair than men.____________
can be used to calculate the probability that the person was a woman.
What is one modeling or descriptive statistical function in MADlib that is typically not provided in a standard relational database?
Scenario: Suppose that Bob can decide to go to work by one of three modes of transportation,
car, bus, or commuter train. Because of high traffic, if he decides to go by car. there is a 50% chance he will be late. If he goes by bus, which has special reserved lanes but is sometimes overcrowded, the probability of being late is only 20%. The commuter train is almost never late, with a probability of only 1 %, but is more expensive than the bus.
Suppose that Bob is late one day, and his boss wishes to estimate the probability that he drove to work that day by car. Since he does not know Which mode of transportation Bob usually uses, he gives a prior probability of 1 3 to each of the three possibilities. Which of the following method the boss will use to estimate of the probability that Bob drove to work?
Suppose that we are interested in the factors that influence whether a political candidate wins an election. The outcome (response) variable is binary (0/1); win or lose. The predictor variables of interest are the amount of money spent on the campaign, the amount of time spent campaigning negatively and whether or not the candidate is an incumbent.
Above is an example of
Logistic regression is a model used for prediction of the probability of occurrence of an event. It makes use of several variables that may be......
Which of the following is a correct example of the target variable in regression (supervised learning)?
Marie is getting married tomorrow, at an outdoor ceremony in the desert. In recent years, it has
rained only 5 days each year. Unfortunately, the weatherman has predicted rain for tomorrow. When it actually rains, the weatherman correctly forecasts rain 90% of the time. When it doesn ' t rain, he incorrectly forecasts rain 10% of the time. Which of the following will you use to calculate the probability whether it will rain on the
day of Marie’s wedding?
Projecting a multi-dimensional dataset onto which vector has the greatest variance?
You are using k-means clustering to classify heart patients for a hospital. You have chosen Patient Sex, Height, Weight, Age and Income as measures and have used 3 clusters. When you create a pair-wise plot of the clusters, you notice that there is significant overlap between the clusters. What should you do?
Refer to exhibit
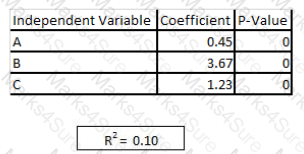
You are asked to write a report on how specific variables impact your client ' s sales using a data set provided to you by the client. The data includes 15 variables that the client views as directly related to sales, and you are restricted to these variables only. After a preliminary analysis of the data, the following findings were made: 1. Multicollinearity is not an issue among the variables 2. Only three variables-A, B, and C-have significant correlation with sales You build a linear regression model on the dependent variable of sales with the independent variables of A, B, and C. The results of the regression are seen in the exhibit. You cannot request additional data. what is a way that you could try to increase the R2 of the model without artificially inflating it?
Which technique you would be using to solve the below problem statement? " What is the probability that individual customer will not repay the loan amount? "
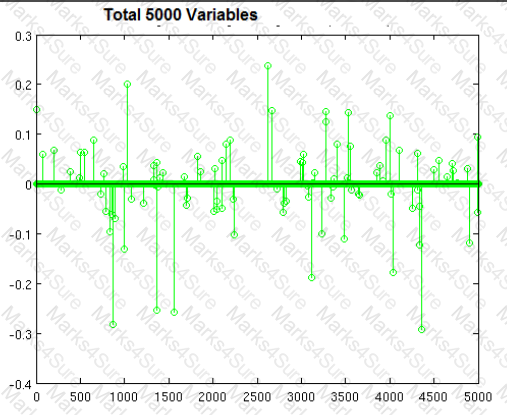
You are building a classifier off of a very high-dimensiona data set similar to shown in the image with 5000 variables (lots of columns, not that many rows). It can handle both dense and sparse input. Which technique is most suitable, and why?
Under which circumstance do you need to implement N-fold cross-validation after creating a regression model?
You have collected the 100 ' s of parameters about the 1000 ' s of websites e.g. daily hits, average time on the websites, number of unique visitors, number of returning visitors etc. Now you have find the most important parameters which can best describe a website, so which of the following technique you will use
You are working in a classification model for a book, written by HadoopExam Learning Resources and decided to use building a text classification model
for determining whether this book is for Hadoop or Cloud computing. You have to select the proper features (feature selection) hence, to cut down on the size of the feature space, you will use the mutual information of each word with the label of hadoop or cloud to select the 1000 best features to use as input to a Naive Bayes model. When you compare the performance of a model built with the 250 best features to a model built with the 1000 best features, you notice that the model with only 250 features performs slightly better on our test data.
What would help you choose better features for your model?
Refer to the Exhibit.
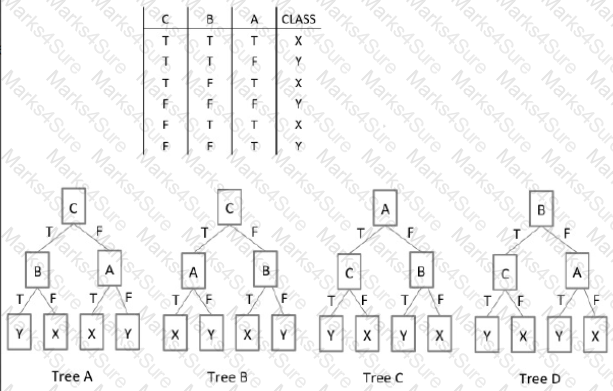
In the Exhibit, the table shows the values for the input Boolean attributes " A " , " B " , and " C " . It also shows the values for the output attribute " class " . Which decision tree is valid for the data?
Select the sequence of the developing machine learning applications
A) Analyze the input data
B) Prepare the input data
C) Collect data
D) Train the algorithm
E) Test the algorithm
F) Use It
Select the correct statement which applies to Principal component analysis (PCA)
A problem statement is given as below
Hospital records show that of patients suffering from a certain disease, 75% die of it. What is the probability that of 6 randomly selected patients, 4 will recover?
Which of the following model will you use to solve it.


TESTED 07 May 2026
 Text
Description automatically generated with low confidence
Text
Description automatically generated with low confidence A picture containing table
Description automatically generated
A picture containing table
Description automatically generated